Key takeaways
- Google's Heat Resilience project opened a public dataset covering more than 50 cities that estimates how reflective each individual roof is, turning satellite imagery into a building-level map for prioritizing cool-roof interventions.
- The method, published in Nature Communications in June 2026, fuses global 10-meter Sentinel-2 imagery with 30-centimeter commercial satellite imagery using computer vision and roof segmentation, validated against aerial measurements in Boulder, Colorado.
- The headline figure of up to 0.5°C of cooling is a modeled estimate from application scenarios, not a measured drop, and accuracy proven in one city may not carry to cities with different materials, density, and climate.
- The real shift is granularity: a city can now rank which specific buildings to treat first instead of applying a blanket policy, but that ranking embeds a human choice between maximum cooling, energy savings, and protecting the most vulnerable.
- The data is open but relies on proprietary layers that cannot be independently audited, so the accountability test is whether a city can justify its priorities beyond that is how the algorithm ranked it.
In this article
The path to cooling a city can start at a highly granular level. It’s not just about asking which neighborhood is hotter, but rather which specific roof absorbs the most sun, which building should be treated first, and where a relatively small municipal investment can yield the highest impact.
This is exactly where Google is stepping in with the expansion of its Heat Resilience project, opening up a public dataset covering over 50 cities worldwide. The goal is to help municipalities, researchers, and urban planners identify roofs with low solar reflectance and prioritize interventions, such as installing “cool roofs.”
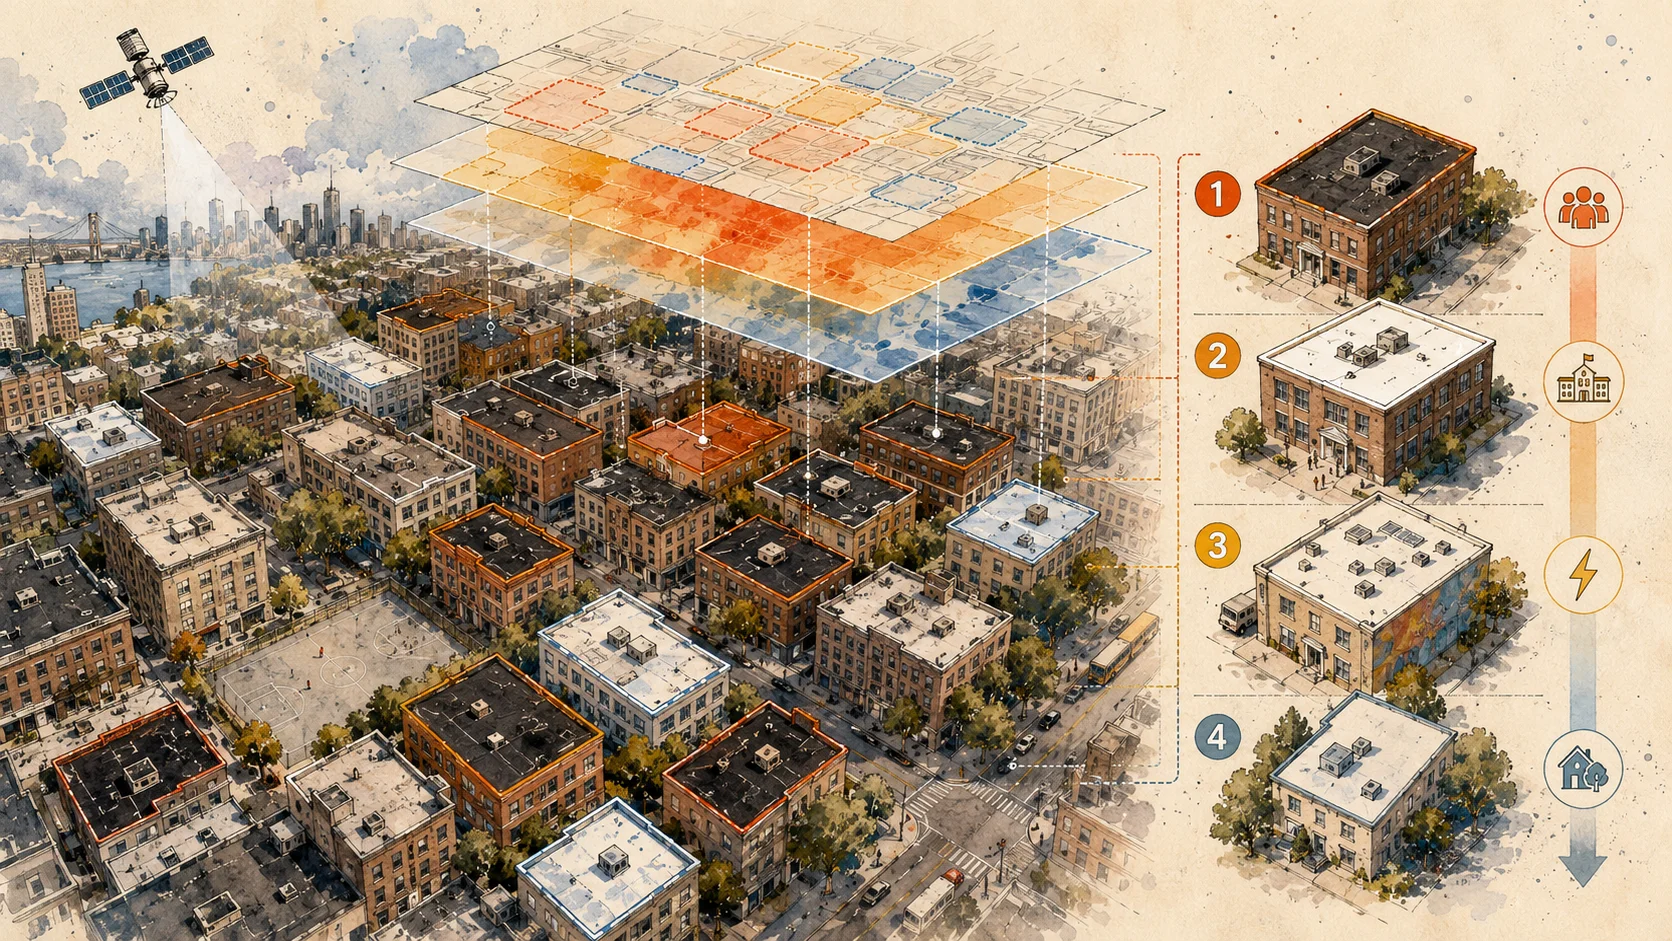
But the story here is much bigger than just roofs. It is a prime example of applying Artificial Intelligence to geospatial data: information tied to physical locations in the real world. Google is fusing satellite imagery at different resolutions with advanced models and calibration techniques to turn pictures into actionable layers of information. We are not talking about theoretical decisions, but real choices regarding renovation budgets, urban climate action plans, building regulations, and the prioritization of heat-vulnerable neighborhoods.
When AI Turns a Satellite Image into a Decision Layer
The core metric in this project is Albedo, the proportion of solar radiation a surface reflects compared to what it absorbs. Dark roofs and fresh asphalt reflect very little radiation and therefore heat up significantly. Light-colored roofs reflect a much larger portion of that radiation, stay cooler, and under the right conditions, reduce the heat load both inside the building and in the surrounding environment. Dark roofing materials absorb as much as 80 to 90 percent of the sunlight that hits them, while purpose-built cool roofing materials can reflect more than 90 percent. In practice most cities sit far closer to the dark end, with an average albedo of just 0.12 to 0.16 (Nature Communications, 2026).
However, a city is not a uniform surface. Within very short distances, you might find a dark roof, a tree, a road, a shadow, and an adjacent building.
To study phenomena on a global scale, researchers use the Sentinel-2 observation satellites, which provide continuous imagery of the entire Earth. While this data is available globally, its resolution is 10 meters. This means the images are designed to show large-scale trends like agricultural growth or climate shifts. They cannot focus on individual objects smaller than an average house. In a dense city, 10-meter resolution simply isn’t enough to understand what is happening on a single roof.
To bridge this gap, Google and its researchers combine the Sentinel-2 data with commercial satellite imagery at a sharp 30-centimeter resolution. This process is called Data Fusion, blending different data sources to get a more accurate and useful picture than any single source could provide alone.
This is where AI truly becomes relevant. It doesn’t cool the city itself, nor does it replace the engineer, the architect, or the urban planner. Its job is to translate visual raw material into planning data. Using computer vision and roof segmentation, the system can identify surfaces, separate different parts of an image, and generate a data layer with a level of detail far beyond a generic heat map.
What the Research Proved, and What Remains a Model
The scientific foundation for this project was published in Nature Communications in June 2026. The researchers combined Sentinel-2 data with commercial satellite imagery to estimate high-resolution Albedo, validating their method against aerial measurements in Boulder, Colorado. The results showed significantly higher accuracy compared to using open data alone.
However, validation in one city does not guarantee identical accuracy in every urban environment. Differences in building materials, density, shadows, makeshift roofs, and planning patterns can all affect the results. This is a crucial point when a system rigorously tested in one location is meant to serve cities that differ drastically in climate, demographics, and physical layout.
The most striking number in the project is the potential to reduce urban temperatures by up to 0.5°C through the targeted deployment of reflective roofs. This is a significant figure, but it must be read with caution. It is an estimation based on application scenarios, not a physical measurement of a city that has already changed its roofs and witnessed this drop.
Still, the practical value is undeniable. Even if half a degree isn’t a guarantee, the sheer ability to prioritize buildings at the individual roof level fundamentally changes municipal work. Instead of a blanket “cool roofs” policy, a city can now ask: which large, dark buildings with the highest environmental impact should be first in line for subsidies, renovations, or new regulations?
Why This is an AI Story, Not Just a Climate Story
At first glance, this is a standard climate-tech piece: roofs, heat, cities, energy. But the deeper angle is the use of AI to transition from identifying a problem to supporting a decision. The model doesn’t just spot a pattern in an image. It transforms that pattern into data meant for a public system bound by budgets, priorities, and accountability to its citizens.
This matters because urban heat is not distributed evenly. The World Health Organization describes heat stress as a major environmental and occupational hazard, and a leading cause of weather-related mortality. In cities, heat accumulates due to dark surfaces, dense construction, roads, a lack of vegetation, and the growing use of air conditioning. It also places immense strain on health, transportation, water, and power grids.
Therefore, Google’s roof map is more than a tool for measuring surfaces. It can become a prioritization layer for schools, public buildings, commercial centers, vulnerable neighborhoods, and large residential complexes. The question isn’t just where a dark roof is located, but where treating that roof will have the greatest positive impact on people, infrastructure, and energy consumption.
Even a Simple Solution Requires a Smart Decision
Reflective roofs are a relatively well-known physical solution. They reflect more sunlight than standard roofs, absorb less energy, lower building temperatures, reduce air conditioning usage, and improve comfort in un-air-conditioned spaces.
But even here, there is no automatic fix. In colder regions, a roof that reflects more sun can reduce passive solar heating in the winter, driving up the need for mechanical heating, a phenomenon known as the “winter penalty.” In many cases, the summer cooling savings offset this cost, but the right decision ultimately depends on the local climate, building insulation, energy usage, and how the building operates.
That is why a good AI map is not a mandate to paint every roof white. It is a decision layer. In a hot, dense city, a wide, dark roof in a shadeless area is an obvious candidate. In a colder city, or in a building where winter heating is the primary expense, the annual energy balance must be calculated. The system’s true value lies in helping planners start where the potential for impact is highest.
Open Data, but Not Fully Transparent
Google has opened this data for public use, and anyone can explore and download the files today. However, it is important to understand that not everything behind the scenes is open. The data also relies on proprietary layers that aren’t available for independent auditing. It is a highly useful tool, but one that must be used critically, especially in public policy, where the difference between an open tool and an auditable one becomes its own governance question.
This brings us to Algorithmic Accountability, the requirement to explain and audit decisions influenced by automated systems. In an urban context, the risk isn’t that the model will independently decide to paint a roof. The risk lies in how authorities will use this data.
A municipality might rely on this map to determine who gets a subsidy, which neighborhood is renovated first, or which buildings are prioritized. When a resident or a community asks why they were excluded from a program, the real test will be the city’s ability to provide a transparent, logical justification that goes beyond the arbitrary excuse of, “That’s how the algorithm ranked it.” That is the same accountability gap that follows automated systems into any organization, not only city hall.
The Real Test is in the Application
The importance of the Heat Resilience project doesn’t stem from Google discovering that dark roofs get hot. Cities, architects, and climate researchers have known that for decades. The true innovation is the attempt to turn satellite imagery, AI, and geospatial data into a practical prioritization tool. This is the kind of application where Artificial Intelligence becomes deeply relevant to public life, because it changes the level of granularity at which decisions can be made.
The ultimate test will happen on the ground. Will municipalities use this data to make better decisions? Will these programs reach the neighborhoods where heat hits the hardest? Can we measure a real, sustained drop in heat stress over time, rather than just potential on a map? And will a tech company’s data layer remain a helpful tool, or will it morph into a black box that dictates public priorities?
A cool roof is a relatively simple technical fix. The data can show us where that intervention is likely to be most efficient. But the choice of what to prioritize first depends on a much broader question: is the city looking for the largest overall temperature drop, the protection of its most vulnerable populations, the highest energy savings, or the easiest projects to execute quickly?
Right there, in the space between the algorithmic model and human civic priorities, lies the real story.
Questions this article gets
What is Google's Heat Resilience project?
Google's Heat Resilience project is a public dataset, expanded in 2026 to cover more than 50 cities worldwide, that estimates how much sunlight each individual rooftop reflects. It is built to help municipalities, researchers, and urban planners find low-reflectance roofs and prioritize interventions such as installing cool roofs, so that limited cooling budgets go to the buildings where they will matter most.
What does the up to 0.5°C urban cooling figure actually mean?
It is a modeled estimate, not a measured result. The research behind the project calculated that targeting the right reflective roofs could lower a city's extreme heat by as much as half a degree Celsius under application scenarios. No city has yet changed its roofs at scale and recorded that drop, so the number is potential impact rather than a guaranteed outcome, and it can vary with local climate, materials, and density.
What is algorithmic accountability in city planning?
Algorithmic accountability is the requirement to explain and audit decisions influenced by automated systems. When a city uses an AI-generated map to decide which neighborhoods or buildings get cooling funding first, residents have a right to know why. The real test is whether officials can give a transparent, logical justification for their priorities, rather than hiding behind the claim that the algorithm ranked it that way.